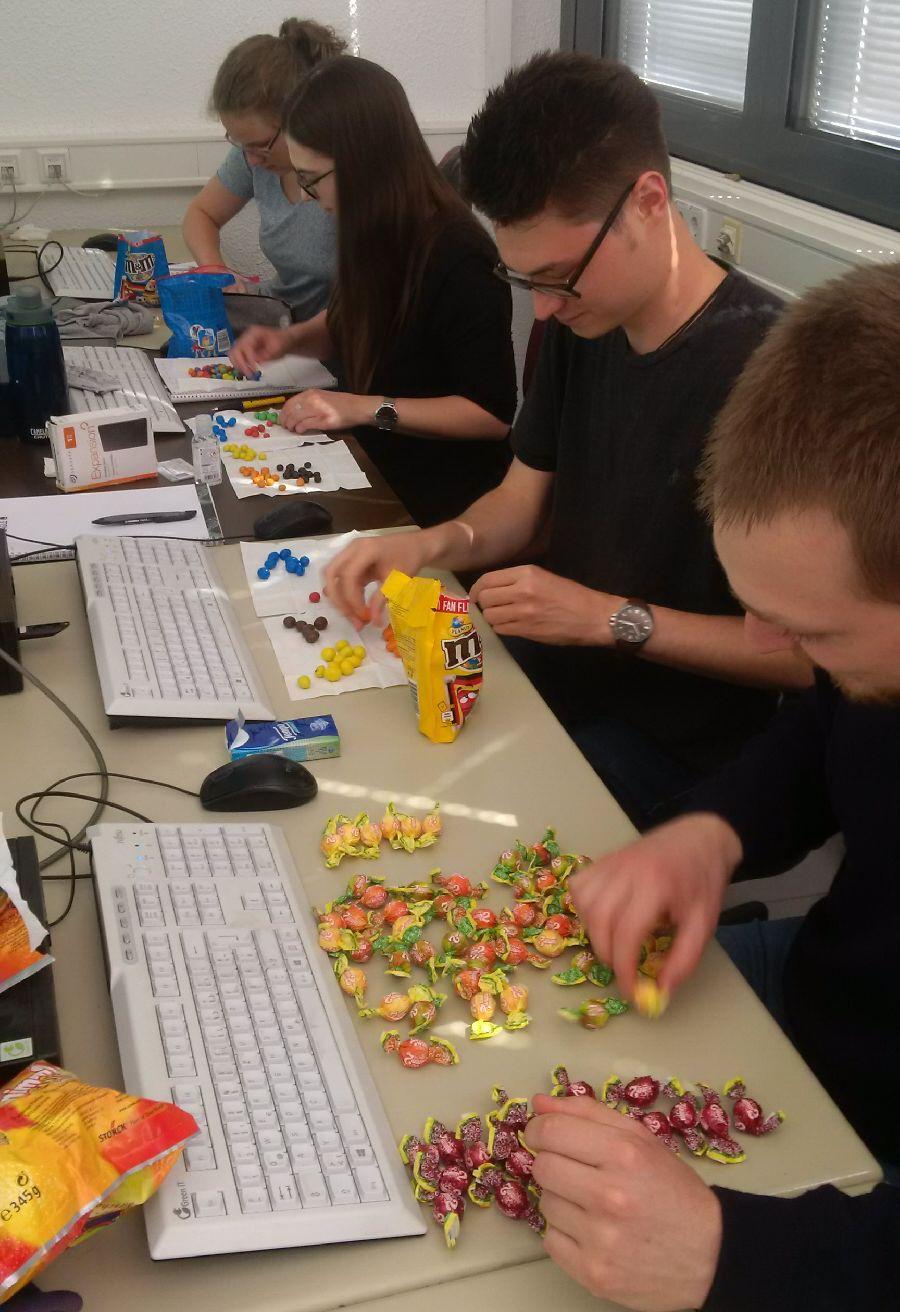
 Today our EAGLE students applied data munging, pipes, plotting and statistics using colour distribution of sweets. They specifically used the dplyr, ggplot, kableExtra and others to compute derivatives, rearrange the data, plot it and run statistics on colour distribution differences between different sweet packages. After this initial task of the course “spatial prediction and modelling” actual spatial prediction of in-situ point data combined with remote sensing data will be performed. This course will cover a wide range of approaches and packages to run spatial models and predict them spatially and temporally.
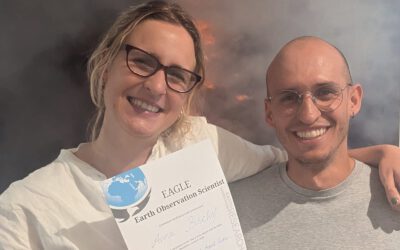
![[spotlight] Lecturer Spotlight: Martin Wegmann](https://eagle-science.org/wp-content/uploads/2026/07/Martin_Wegmann_EAGLE_lecture_2026-400x250.jpg)
[spotlight] Lecturer Spotlight: Martin Wegmann
If you've ever sat in a Würzburg classroom learning how to wrangle satellite data, there's a good chance Martin Wegmann was the one standing at the front. He's been the driving force behind the EAGLE MSc program, the Applied Earth Observation degree at the University...