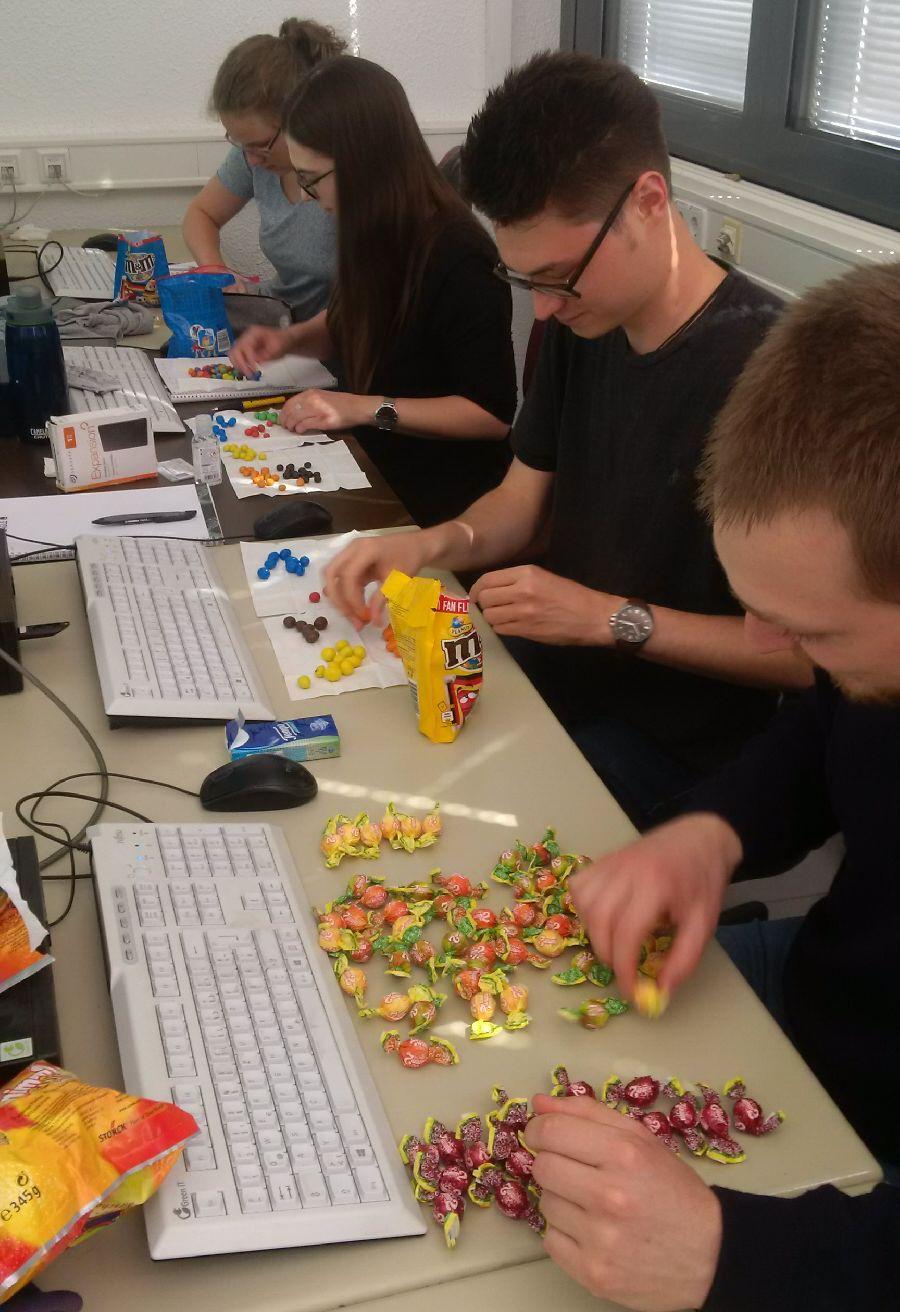
 Today our EAGLE students applied data munging, pipes, plotting and statistics using colour distribution of sweets. They specifically used the dplyr, ggplot, kableExtra and others to compute derivatives, rearrange the data, plot it and run statistics on colour distribution differences between different sweet packages. After this initial task of the course “spatial prediction and modelling” actual spatial prediction of in-situ point data combined with remote sensing data will be performed. This course will cover a wide range of approaches and packages to run spatial models and predict them spatially and temporally.
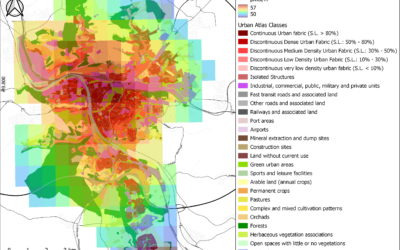
Master Thesis Defense: “Assessing Air Pollution in Urban Environments: A Comprehensive Analysis Using Earth Observation and In Situ Measurements” on Friday, March 08 at 13:00
On Friday, March 08, at 13:00, Andreas Bury will present his master thesis on "Assessing Air Pollution in Urban Environments: A Comprehensive Analysis Using Earth Observation and In Situ Measurements" in seminar room 3, John-Skilton-Str. 4a. From the...