Salim Soltani will defend his M.Sc. thesis “Spatio-temporal Analysis of Urbanization caused by the New Silk Road” on Friday 11th at 10am.
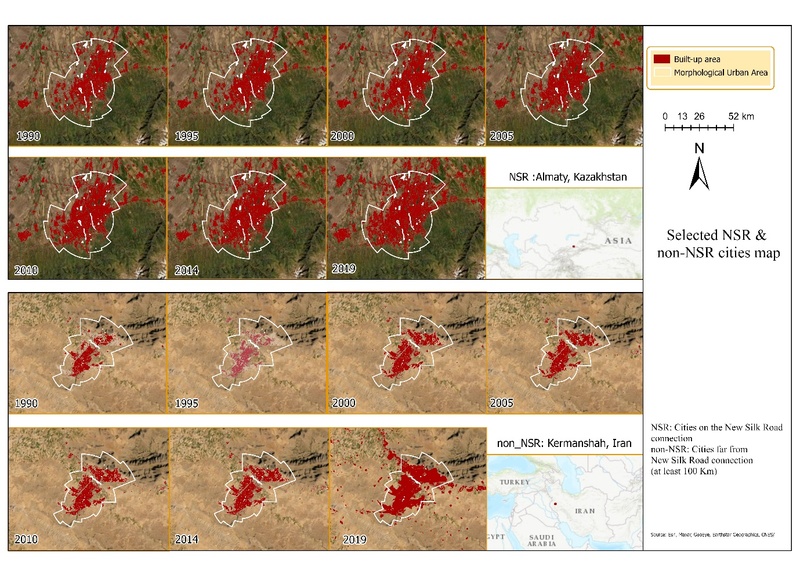
From the abstract: “It is evident that the world population is growing, and the current population forecasts predict a steady increase in upcoming decades, a majority of which will be living in urban areas. This results in increased demands in natural resources and living space. As a result, urban areas have expanded considerably, and new settlements and urban agglomerations continue to emerge globally. Based on the report from the UN on the urbanization prospects revision, as of 2018, 55% of the world’s population lived in the cities, a proportion which is projected to increase to 68% by 2050. From this increase, nearly 90 percent of it takes place in Asia and Africa. For the challenges of current and future trends in urbanization, data and methods are therefore needed to observe and quantify the changes and induced by urban growth. Therefore, the objective of this study was to analyze the urbanization caused by the New Silk Road. This is done by extracting urban areas from multitemporal Landsat data from 1990 to 2019 with a combination of the Global Human Settlement Layer (GHSL). In order to achieve this, the Landsat data is utilized to classify urban areas in 1995, 2005, 2010, and 2019 using Google Earth Engine online (GEE) platform. Then the result of the classification is combined with GHSL, which shows the urban area in 1990, 2000, and 2014 in order to make a consistent urban built-up area extent information with five year time steps. The Random Forest (RF) supervised classification is applied to classify the built-up areas. The methodology used Gray-Level Co-Occurrence Matrix (GLCM) textures features together with spectral indices as input data. The stratified sampling method is used to generate training data from GHSL data as well as ESA annual Landcover. The accuracy of classification is evaluated using RF accuracy assessment function, and visually compared against high and medium resolution images. The classification accuracy varied in different cities, but in general, the result was acceptable. The study area includes cities with over 300 thousand inhabitants on the New Silk Road (NSR cities) connection and far (at least 100 km) from the NSR connection (non-NSR cities); these cities located in China, central Asian countries, Iran, Turkey, and Russia. In this study it is assumed that NSR and its investment projects triggered an increased urbanization in the cities connected to it. Therefore, this study, analysed the Spatio-temporal urban expansion of both NSR and non-NSR cities and their urbanization trends were compared. Urbanization indices were utilized to measure and quantify the urbanization trends in both cities.
Generally, the results of this study have demonstrated that the considered methodology was able to extract urban areas successfully. The analysis of urbanization shows that there was an increased expansion of built-up areas in the last 29 years in both cities far from and on the New Silk Road connection. The spatial comparison trend of urban expansion between cities showed that cities on the New Silk Road connection grew significantly faster from 2010 onward compare to cities far from the New Silk Road connection.” supervised by Hannes Taubenböck and Martin Wegmann, mentored by Thorsten Dahms