Aim
The module addresses methods on how Earth Observation and the use of geoinformation can support different fields of land and water management. The students will be guided to gain knowledge in selected practical examples.
Content
A general introduction on the subject, which strongly integrates large fields of environmental sciences and studies, is given. The students select topics in which remote sensing and geoinformation can significantly contribute parameters for answering relevant management questions. The topics include the derivation and use of parameters for monitoring land and/or water resources and examples how they can actually implemented in analytical or predictive models, or in indicator systems. The examples may include the management of the resources in rangelands, croplands, irrigation and drainage systems, river catchments, urban areas, or others. Focus may be set on special geographical settings. Depending on the selected topics and scale relevant Earth Observation parameters can include land cover and land use mapping, biophysical variables (LAI/FPAR/Chlorophyll, evapotranspiration , etc.), biomass or crop yields, soil moisture, phenological metrics and other dynamic parameters.
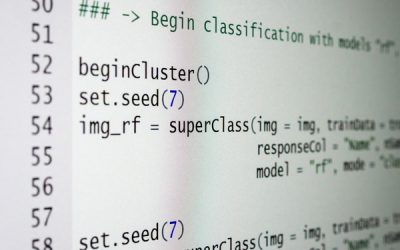
Coding
Software
Techniques
Content
General Course News and Updates
EAGLE M.Sc. idea presentations
On Monday, 24th of September from 1:30 onwards the following EAGLE students will present their M.Sc. idea. Everybody is welcome to join their presentations and to provide feedback: Julia: "Time-Series Analysis of Sentinel-1 and Sentinel-2...

EAGLE Internships
On Monday, 24th of September, at 1pm the following internship reports will be presented: Bharath: "Installation and Characterization of an imaging Spectrometer for the UAV-based remote sensing" Johannes: "Crop classification based on S1/S2 in...
New MSc thesis: Time series analysis in Colombian Orinoco Basin
Pilar Endara started her M.Sc. thesis on "Time series analysis of flooding and vegetation patterns in wetlands of the Colombian Orinoco Basin" The ecosystems that are present within Colombian Orinoquia flooded savannas are currently being threatened by conversion of...

Internship, Innovation Lab and MSc idea presentations
The following students presented their innovation labs, internships and ideas for MSc. thesis: Ahmed: Innovation Lab at DLR (team of Ursula Gessner) and Master Thesis Idea: Title: Status of Agricultural Lands in Egypt using Earth Observation Maninder (at DLR,...
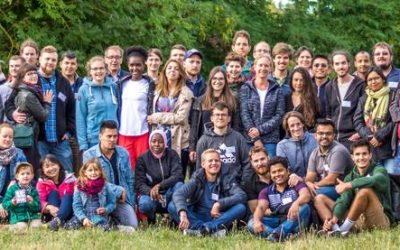
EAGLE summer dialogue 2018
Our 2018 EAGLE summer dialogue took place last Friday, 22nd of June and was a great place to meet all students, lectures, staff of the department and quite some external guests from all around Europe.
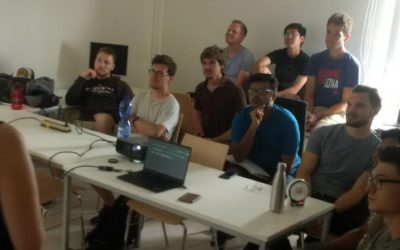
Internship and Innovation Lab presentations
Today some of our EAGLE students presented their internship and innovation laboratory projects. Very interesting topics and they obviously applied and deepened their remote sensing knowledge a lot. Julia Sauerbrey: Prediction of Organic Matter Content from Sentinel-2...
application deadline is approaching – May 15th
the application deadline for our next term of the international M.Sc. program EAGLE “applied Earth Observation and Geoanalysis of the Living Environment” is approaching. Application for the upcoming winter term are accepted until May 15th
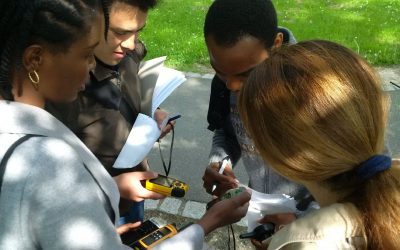
EAGLE students learn remote sensing field work
The course "from field work to spatial data" by Tobias Ullmann and Martin Wegmann is covering the whole range of field campaign planning and especially training all necessary methods such as GPS handling, coordinate systems, setting waypoints or finding locations. In...

MSc thesis started by Jakob Schwalb-Willmann
Jakob Schwalb-Willmann just started his M.Sc. thesis titled "A deep learning movement prediction model using environmental data to identify movement anomalies". He will combine animal movement and remote sensing data in order to develop a generic, data-driven DL-based...
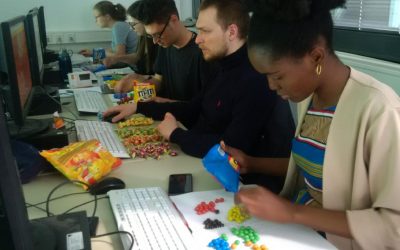
EAGLE students coding with sweets
Today our EAGLE students applied data munging, pipes, plotting and statistics using colour distribution of sweets. They specifically used the dplyr, ggplot, kableExtra and others to compute derivatives, rearrange the data, plot it and run statistics on colour...