Aim
Designing scientific graphics that provide all necessary information without being too packed, focusing on the essential message and being able to actually create such graphics will be covered In this class. All necessary tools and and approaches to create adequate figures and maps will be covered.
Content
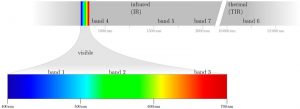
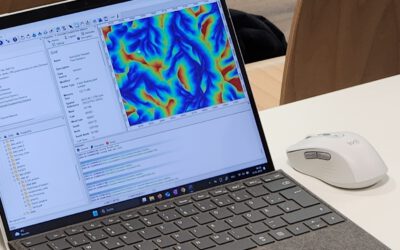
figure from the book “Remote Sensing and GIS for Ecologists” by Wegmann, Leutner and Dech, created with tikz
General guidelines of scientific graphics and maps will be covered based on e.g. Tufte and followed by practical implementation of graphic ideas, as well as critical evaluation of the results. Only open source program will be used such as R or tikz/pgf and students will have the opportunity to work specifically on certain scientific graphics or maps using e.g. ggplot2 and explore the potential and limits of good scientific graphs. Good map designs will be discussed as well and common mistakes will be pointed out. After this course you will be capable to create your own graphics for a specific scientific purpose e.g. your M.Sc. thesis.
Coding
Software
Techniques
Content
General Course News and Updates
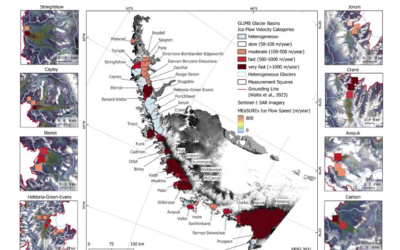
EAGLE Master Defense “High Performance Computing for Earth Observation Time Series Analysis: A Case Study on Glacier Dynamics on the Antarctic Peninsula”
On February 28, 2025, Sarah Leibrock will present her internship on "High Performance Computing for Earth Observation Time Series Analysis: A Case Study on Glacier Dynamics on the Antarctic Peninsula" at 11:00 in seminar room 3, John-Skilton-Str. 4a.High Performance...
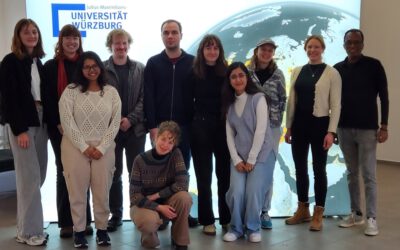
EAGLE course by Dr. Celia Baumhoer on Polar and Glacier Earth Observation
Our EAGLE students had this week the opportunity to attend an intensive course led by Dr. Celia Baumhoer, an expert in Earth observation of polar and glacier ecosystems. The course, which covered both the Antarctic and Arctic regions, as well as glaciers in the Alps,...

EAGLE Students Explore LiDAR Data with QGIS, Whitebox, and CloudCompare
At EAGLE, our students continuously expand their expertise in Earth observation by learning various data processing techniques. Today, they are diving into LiDAR data analysis, using QGIS, Whitebox, and CloudCompare to enhance their skills in handling different remote...

Exploring Whitebox Tools: EAGLE Students Dive into Geomorphology and Hydrology Applications in QGIS
In the world of Earth observation and geospatial analysis, staying ahead of the curve requires familiarity with the diverse environments and various powerful scientific software tools. At EAGLE, our students have the opportunity to also explore the vast potential of...
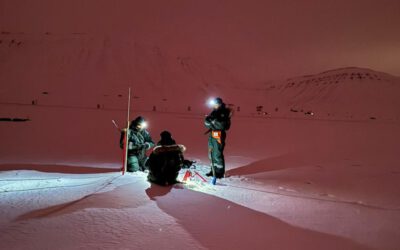
Exploring the Arctic: Eagle MSC Students Lena and Ronja Conducting UAS Research
The Arctic is one of the most extreme and fascinating environments on Earth, offering an unparalleled opportunity for scientific research. For Eagle MSC students Lena and Ronja, this unique landscape is not just a place of study—it's also an unforgettable adventure....
Integrating R and Whitebox Tools for Geospatial Analysis
Within the EAGLE M.Sc. program our Earth Observation students have managed to understand some important research approaches within just the first term of their studies. Integrating and working with several environments simultaneously is a critical tasks for their...
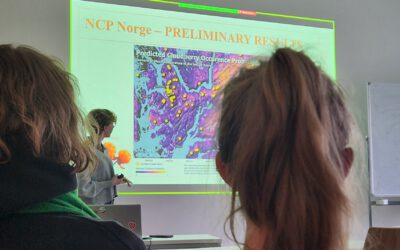
Mapping NCPs in Norway: An Internship Presentation by Sonja Maas
On January 28, 2025, Sonja Maas delivered an insightful presentation on her internship project titled "Mapping Ecosystem Services in Norway." Hosted by the University of Bergen, this internship focused on the critical role that nature plays in supporting human...
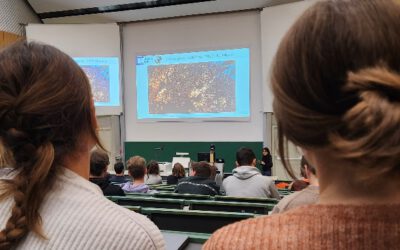
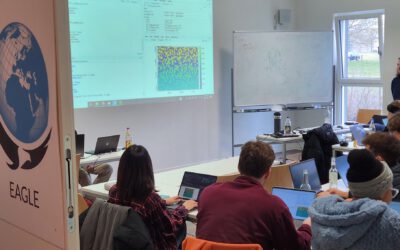
Our Eagles Soar in Remote Sensing: A Look Back at Their Successful Scientific Presentation Course
We are thrilled to share the amazing achievements of our talented students who recently completed their scientific presentation course with flying colors. Our eagles had the exciting opportunity to introduce over 100 BSc students to the world of remote sensing,...
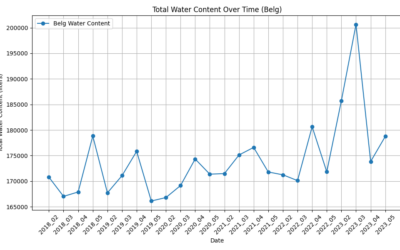
EAGLE Internship Presentation “Effect of Semicircular Bunds for Soil moisture conservation in Ethiopia”
On January 28, 2025, Suriya Elango will present his internship on "Effect of Semicircular Bunds for Soil moisture conservation in Ethiopia" at 12:00 in seminar room 3, John-Skilton-Str. 4a. From the abstract: This study assessed the impact of semi-circular soil...
Empowering Future Earth Observation Experts! 🌍
At EAGLE, our Earth Observation students are diving deep into the fascinating world of geospatial analysis! Through hands-on training, they master cutting-edge algorithms and techniques to address pressing environmental challenges such as Georisk Assessment:...