Aim
Designing scientific graphics that provide all necessary information without being too packed, focusing on the essential message and being able to actually create such graphics will be covered In this class. All necessary tools and and approaches to create adequate figures and maps will be covered.
Content
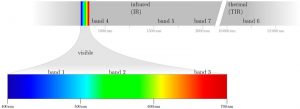
figure from the book “Remote Sensing and GIS for Ecologists” by Wegmann, Leutner and Dech, created with tikz
General guidelines of scientific graphics and maps will be covered based on e.g. Tufte and followed by practical implementation of graphic ideas, as well as critical evaluation of the results. Only open source program will be used such as R or tikz/pgf and students will have the opportunity to work specifically on certain scientific graphics or maps using e.g. ggplot2 and explore the potential and limits of good scientific graphs. Good map designs will be discussed as well and common mistakes will be pointed out. After this course you will be capable to create your own graphics for a specific scientific purpose e.g. your M.Sc. thesis.
Coding
Software
Techniques
Content
General Course News and Updates
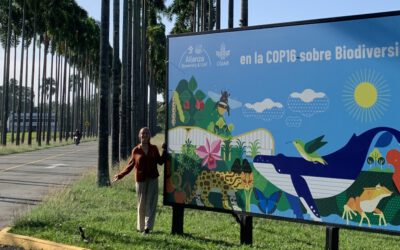
EAGLE internship at CIAT in Colombia
Leonie, an 8th generation EAGLE, is currently doing her internship at CIAT (International Center of Tropical Agriculture) in South America, Colombia. She is part of the Multifuncional Landscapes group, which investigates about soil organic carbon sequestration in...
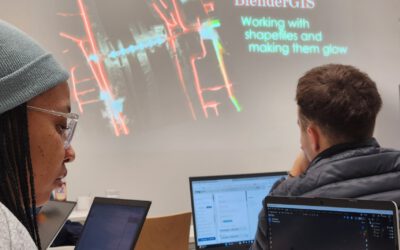
Blender GIS introduction
Within out EAGLE Earth Observation M.Sc. we also cover software applications which might not be used on a regular basis within our field of research but are sometimes highly useful to display our spatial data in a visually appealing way - and also potentially provides...
EAGLE presentation by Gökçe Yağmur Budak
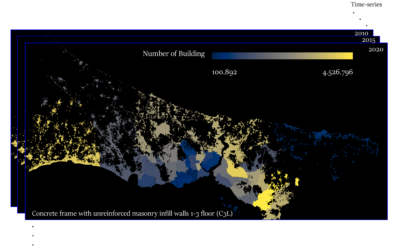
On November 26, 2024, Gökçe Yağmur Budak will present her internship results on " Leveraging Data-Driven Approaches for Seismic Risk Assessment in Istanbul " at 12:30 in seminar room 3, John-Skilton-Str. 4a. From the abstract: This internship aims to create time...
Internship presentation by Jean de Dieu Tuyizere: Mapping leaf area index in Ghana and Senegal using Gaussian process regression and Sentinel-2 Imagery
On November 26, 2024, Jean de Dieu Tuyizere will present his internship results on " Mapping leaf area index in Ghana and Senegal using Gaussian process regression and Sentinel-2 Imagery" at 12:00 in seminar room 3, John-Skilton-Str. 4a. From the abstract: This study...
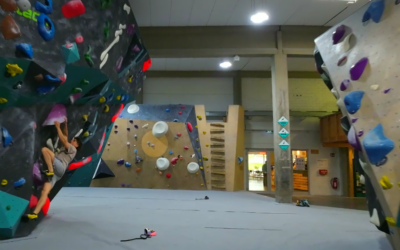
social bouldering event
Last Friday did we organize again a social event for all staff members and EAGLEs to get to know the new students, meet and chat with old students and just have a nice time outside the office for all staff members. We spend 4 hours together in the Rock In boulder gym...
Innolab presentation: Deep Learning-driven Image Super-Resolution for TerraSAR-X
On November 05, 2024, Jannik Hoffmann will present his InnoLab results on " Deep Learning-driven Image Super-Resolution for TerraSAR-X" at 12:00 in seminar room 3, John-Skilton-Str. 4a. From the abstract: High-resolution satellite Synthetic Aperture Radar (SAR) data...
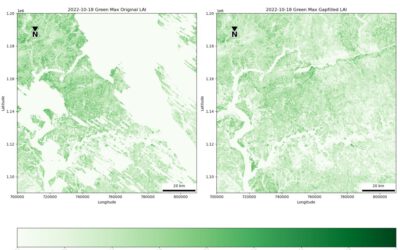
Master Defense: Discovering Hydrographic Parameters of HydroSHEDS and TanDEM-X Digital Elevation Model through Exploratory Data Analysis” at 12:00 seminar room 3, John-Skilton-Str. 4a.
On October 29, 2024 Subarno Shankar will present his master thesis " Discovering Hydrographic Parameters of HydroSHEDS and TanDEM-X Digital Elevation Model through Exploratory Data Analysis" at 12:00 seminar room 3, John-Skilton-Str. 4a. From the abstract: Climate...
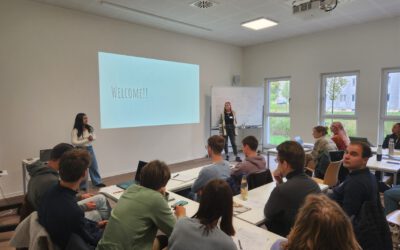
Welcome of new EAGLEs
The EAGLEs from the last generation welcomed our new earth observation students to the EAGLE M.Sc. program and gave them a glimpse of their last 12 months - from coding to socialising, pub crawls to joint hikes and also a lot of best wishes from all the other EAGLEs...
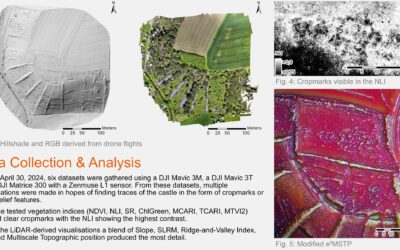
Research by Jannis Midasch presented at Archaelogy conference
Our EAGLE student Jannis Midasch presented his work on "Rediscovering a lost medieval castle using GIS and UAS-based remote sensing" at the Annual Meeting of the Aerial Archaelogy Research Group in York, UK this September. Jannis used various UAS/drone based...
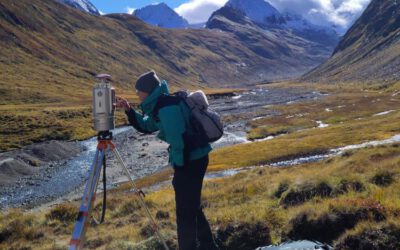
Summer School of Alpine Research
Last week, Laura, an 8th gen EAGLE Student, participated in the Summer School of Alpine Research, conducted by the University of Innsbruck, in the beautiful location of the Austrian Oetztal in Obergurgl. The focus of the Summer School was on Close Range Sensing...