Aim
Designing scientific graphics that provide all necessary information without being too packed, focusing on the essential message and being able to actually create such graphics will be covered In this class. All necessary tools and and approaches to create adequate figures and maps will be covered.
Content
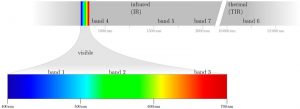
figure from the book “Remote Sensing and GIS for Ecologists” by Wegmann, Leutner and Dech, created with tikz
General guidelines of scientific graphics and maps will be covered based on e.g. Tufte and followed by practical implementation of graphic ideas, as well as critical evaluation of the results. Only open source program will be used such as R or tikz/pgf and students will have the opportunity to work specifically on certain scientific graphics or maps using e.g. ggplot2 and explore the potential and limits of good scientific graphs. Good map designs will be discussed as well and common mistakes will be pointed out. After this course you will be capable to create your own graphics for a specific scientific purpose e.g. your M.Sc. thesis.
Coding
Software
Techniques
Content
General Course News and Updates
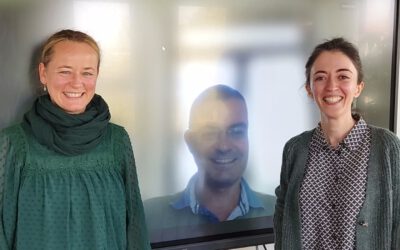
Internship Report by Janik Hoffmann and Lena Jäger
On Tuesday, December 19, 2023 at 12:00 Janik Hoffmann and Lena Jäger will present their internship report on their internship at the University Centre on Svalbard/Norway "Our Arctic Adventure – Northernmost internship on Svalbard" in seminar room 3 in...
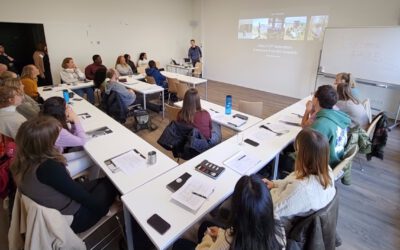
welcome of new EAGLE generation
Today we welcomed the new generation of Earth Observation EAGLE students and are happy to see such a diverse and highly motivated group of students again. Students from Nepal, India, Ruanda or Turkey joint our study program among many other countries and already in...
MSc defense by Vanessa Rittlinger
On Friday,October 24, 2023 at 10:00 a.m. Vanessa Rittllinger will present her master thesis on “Detection of landslides in space and time using optical remote sensing data – A case study in South Tyrol” From the abstract: Landslides as a natural hazard cause damage...
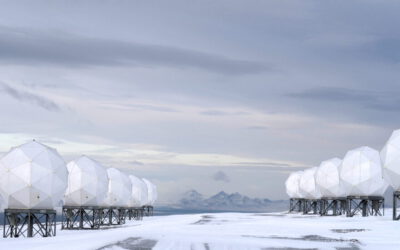
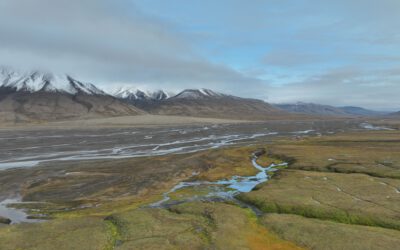
EAGLE MSc students working in the Arctic
From August to November, two EAGLE students had the opportunity to do their internship at the University Centre in Svalbard (UNIS), working in the department of Arctic Biology. Their tasks included regular drone flights in Adventdalen, a valley close to the world’s...
MSc defense by Narges Mohammadi Khoshouei
On October 06, 2023, Narges Mohammadi Khoshouei (Sanaz) successfully defended her master’s thesis entitled “Short-term forecast of water reservoir dynamics by integrating earth observation and hydrological modeling for dam management” at the Earth Observation Research...
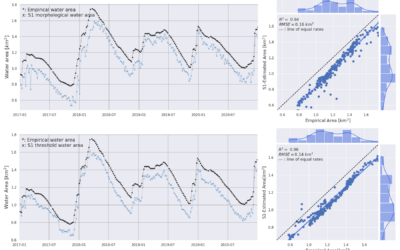
MSc Defense by Narges Mohammadi Khoshouei
MSc Defense by Narges Mohammadi Khoshouei On Friday, October 09, 2023, at 10 a.m. Narges Mohammadi Khoshouei will present her MSc thesis "Short-term forecast of water reservoir dynamics by integrating earth observation and hydrological modeling for dam management" in...
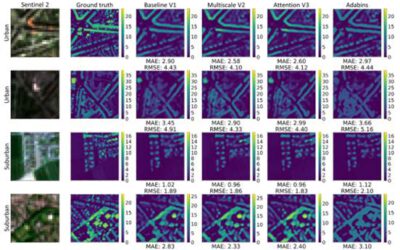
Our EAGLE student Konstantin published an article on deep neural network regression for digital surface model generation
Our EAGLE M.Sc. student Konstantin together with our EOR cluster professor and EAGLE lecturer Hannes Taubenböck published an article about the capabilities of deep neural network regression for digital surface model generation with Sentinel-2 Imagery. Konstantin...
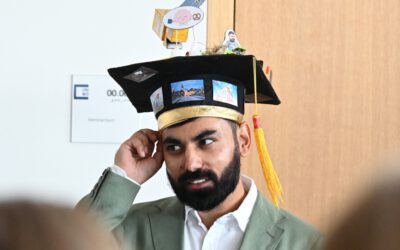
first EAGLE MSc. student defended his PhD
one of our very first EAGLE M.Sc. students Maninder Dhillon successfully defended his PhD! Congratulations by the whole EAGLE program and of course all EAGLE students - many of the young and older students joined his presentation and listened to his topic of...
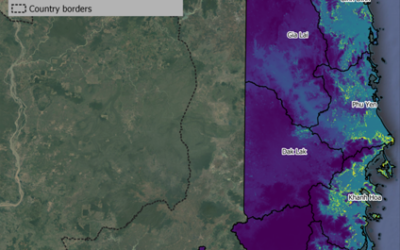
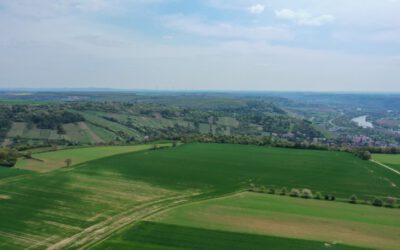
M.Sc. defense by Luisa Pflumm on remote sensing for decision making
Luisa will defend her M.Sc. thesis "Using remote sensing to enhance conservation decision-making: The case of the little-known silver-backed chevrotain" this Friday at 10am in the meeting room John Skilton 4a. From her abstract: "Southeast Asia is a biodiverse region...
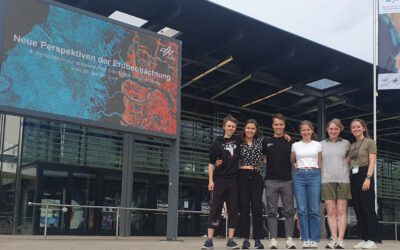
EAGLEs at DLR’s 4th Symposium “New Perspectives on Earth Observation”
From the 26th to the 28th of June, the fourth symposium on Applied Satellite Earth Observation, organized by the DLR took place in Bonn and some of the current EAGLE generation did not miss the opportunity to make a fun trip to the former capital of Germany. From...