Aim
Designing scientific graphics that provide all necessary information without being too packed, focusing on the essential message and being able to actually create such graphics will be covered In this class. All necessary tools and and approaches to create adequate figures and maps will be covered.
Content
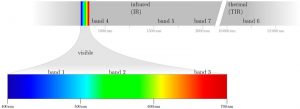
figure from the book “Remote Sensing and GIS for Ecologists” by Wegmann, Leutner and Dech, created with tikz
General guidelines of scientific graphics and maps will be covered based on e.g. Tufte and followed by practical implementation of graphic ideas, as well as critical evaluation of the results. Only open source program will be used such as R or tikz/pgf and students will have the opportunity to work specifically on certain scientific graphics or maps using e.g. ggplot2 and explore the potential and limits of good scientific graphs. Good map designs will be discussed as well and common mistakes will be pointed out. After this course you will be capable to create your own graphics for a specific scientific purpose e.g. your M.Sc. thesis.
Coding
Software
Techniques
Content
General Course News and Updates
MSc. presentation by Fowad Ahmed
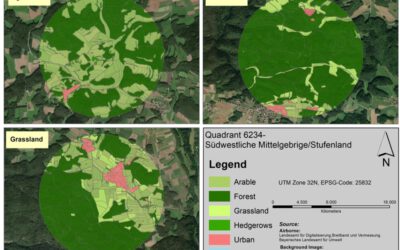
Fowad Ahmed will present his M.Sc. thesis "Agricultural landscape Configuration and Pattern Analysis with VHR Imagery in Bavaria" on Friday 11th at 11am. from the abstract: "Hedgerows and woody linear features are an integral part of the landscapes where they exist....
M.Sc. defense by Nina Gnann
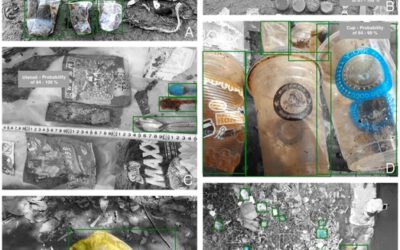
Nina Gnann will present her M.Sc. thesis "Identification of anthropogenic debris assisted by unmanned aerial vehicles and deep learning” on September 8th 12pm. From the abstract: Due to anthropogenic actions, plastic and other debris are distributed in the environment...

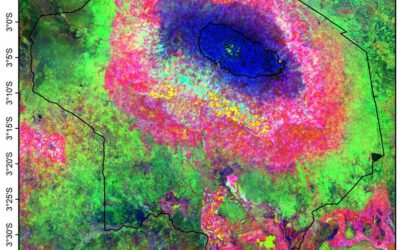
MSc thesis presentations by Navid Chamani
Navid Chamani is defending his thesis "Investigation on the intra-annual variations of the relationship between Landsat 8-derived LST and spectral indices in west Africa" on September 25th 10am. from the abstract: "Monitoring the variations of the land surface...
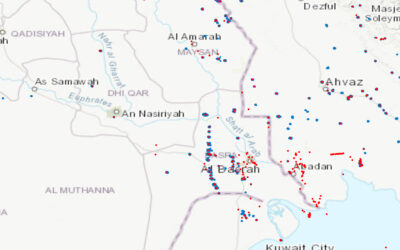
MSc defense by Salim Soltani
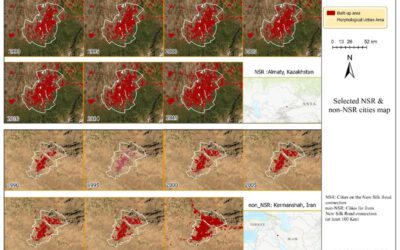
Selected map of NSR and non_NSR cities from 1990-2019, NSR cities represent the cities located directly on the New Silk Road , and non_NSR cities represent cities located far from( at least 100 Km) the New Silk Road. Salim Soltani will defend his M.Sc. thesis...
New EAGLEs in 2020
we are finally through all 140 interviews of eligible EAGLE applications. We had again very good and highly suitable candiates and in total 25 applicants passed the interviews and are accepted to the EAGLE program. Our new EAGLEs are from various countries (15...
M.Sc. Defense by Felix Glasmann
Felix Glasman will defend his M.Sc. thesis "The FireBIRD Mission: Potential for the Detection of Gasflaring" on Thursday 30th of July at 11am. From his abstract: "The controversial but widespread process of gas flaring has received growing attention over the recent...
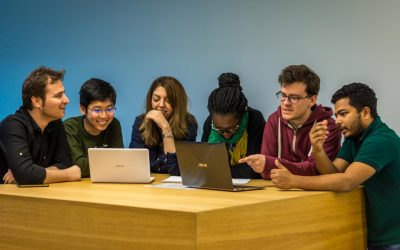
Internship presentations
On Thursday 30th at 10 am the following EAGLE students will present their internships or inno labs: Tobias Gutzmann: 'Aerial Image Analysis for WW2 Warfare Material Detection' at Luftbilddatenbank Henrik Fisser: 'Sentinel-2 Truck Detection - Sensing Trade from Space...
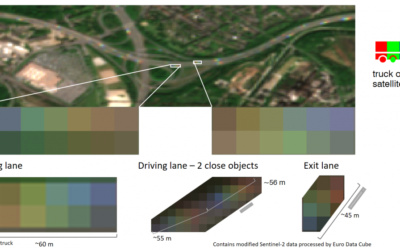
EAGLE student Henrik Fisser won ESA competition
Congratulations to Henrik Fisser, whose Sentinel-2 analysis on truck detection has been awarded the first prize for the European Data Cube COVID-19 contest! He uses the reflectance patterns of long moving vehicles in Sentinel-2 images. Please see the ESA webpage for...
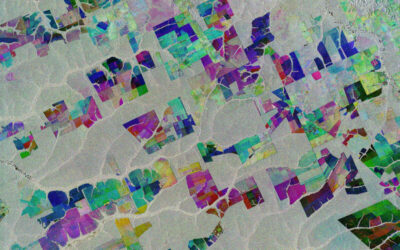
MSc defense by Katrin Hasenbein
Katrin Hasenbein will defend her M.Sc. thesis on Thursday 12am on "The potential to enhance land use mapping by leveraging processing methods of time series data". from the abstract: "With the launch of the twin satellites of Sentinel-2 time series data with a high...
2020 applications
We received again a high number of very good applicants and are currently working through all application files. We will invite all eligible applicants in the next weeks for an interview. In total we received 137 eligible applications from the EU as well as North and...