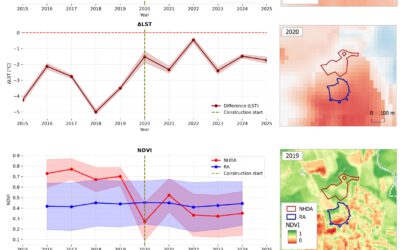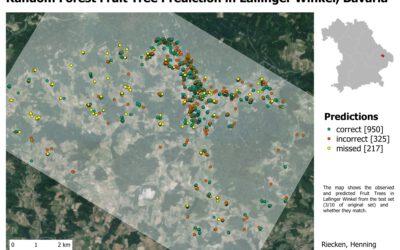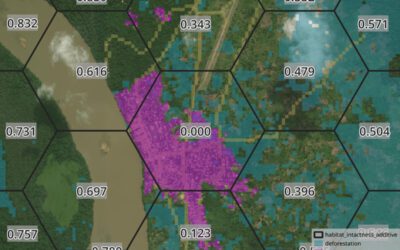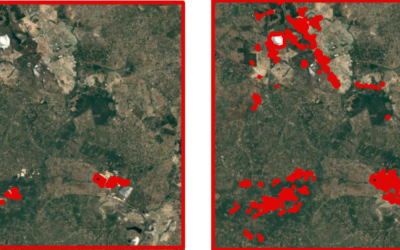

Beside the various remote sensing courses such as radar, cloud computing, terrain analysis, urban analysis etc. we do also offer courses on softskills such as scientific writing, presentations as well scientific graphics and maps.
Within our scientific graphics course do we cover advanced methods in ggplot to create meaningful and good looking graphics, we introduce the students to tikz and pgf, the latex graphics engines and also interactive graphics and maps via shiny.
Always great to discuss with our students the potential and use case for such graphics and also critically evaluate existing graphics for their informative value and if the scientific findings are properly and visually appropriate displayed.
Within our scientific graphics course do we cover advanced methods in ggplot to create meaningful and good looking graphics, we introduce the students to tikz and pgf, the latex graphics engines and also interactive graphics and maps via shiny.
Always great to discuss with our students the potential and use case for such graphics and also critically evaluate existing graphics for their informative value and if the scientific findings are properly and visually appropriate displayed.

![[Spotlight] Lecturer Spotlight: Julian Faeth](https://eagle-science.org/wp-content/uploads/2026/10/Julian_Faeth_EORC_EAGLE_2026-400x250.jpg)