You are all invited to join the M.Sc. presentation by Johannes Löw. He will defend his M.Sc. thesis on Wednesday 20th of March at 2pm in room 0.004 in OKW 86.
from his abstract:
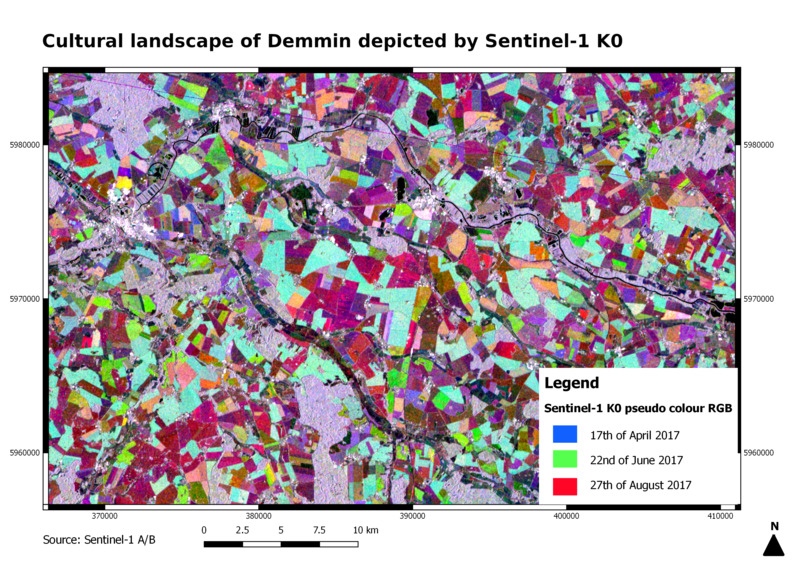
Since Sentinel-1 A and B have become fully operational, it is now possible to generate dense time series (six-day interval) for areas, which have been difficult to monitor by optical data due to cloud cover issues. In addition, over the last ten to twenty years, the derivation of phenological information from Synthetic Aperture Radar (SAR) data has been researched intensively. This study utilised dense time series of interferometric (InSAR) and polarimetric (PolSAR) features, which were temporally smoothed by GAM or LOESS-algorithms to create crop specific signatures for wheat, sugar beet, rapeseed and grassland for the growing season of 2017. In a first step, by computing descriptive statistics for crop parameters and SAR-features the discriminatory potential as well as the temporal stability of the data basis were assessed. Secondly, a qualitative analysis linking phenological stages to the behaviour of these signatures was conducted. The last step consisted of a correlation and regression analysis of wheat fields encompassing SAR features and the following crop parameter: plant height, crop cover and BBCH-values. By investigating the descriptive statistics VV backscatter intensity, entropy and K0 exhibited the highest discriminatory potential. The qualitative analyses allowed for the distinction of vegetative and reproductive stages for wheat and rapeseed. Furthermore, certain BBCH-stages like the leaf and the rosette development of sugar beet or the main shoot and the ripening of wheat were detected. The regression and correlation analysis revealed moderate negative correlation coefficients
(Pearson) for VV and VH coherence and plant height (-0.57 and -0.61). By conducting a regression analysis for each time step a decline in R2 during midseason was discovered. In the first half of the season R2 above 0.9 occurred for a pairing of Alpha, VH coherence and K0 with plant height and crop cover, whereas in the second half R2 did not surpass value above 0.6. Especially the findings of the qualitative analysis demonstrated that a composite of InSAR and PolSAR data displays the potential for feasible crop phenology monitoring.

