Christabel will present her M.Sc. thesis “ASSESSING THE ENVIRONMENTAL IMPACT OF OIL SPILLS IN THE NIGER DELTA, NIGERIA” on Monday 20th of December at 10am. From the abstract:
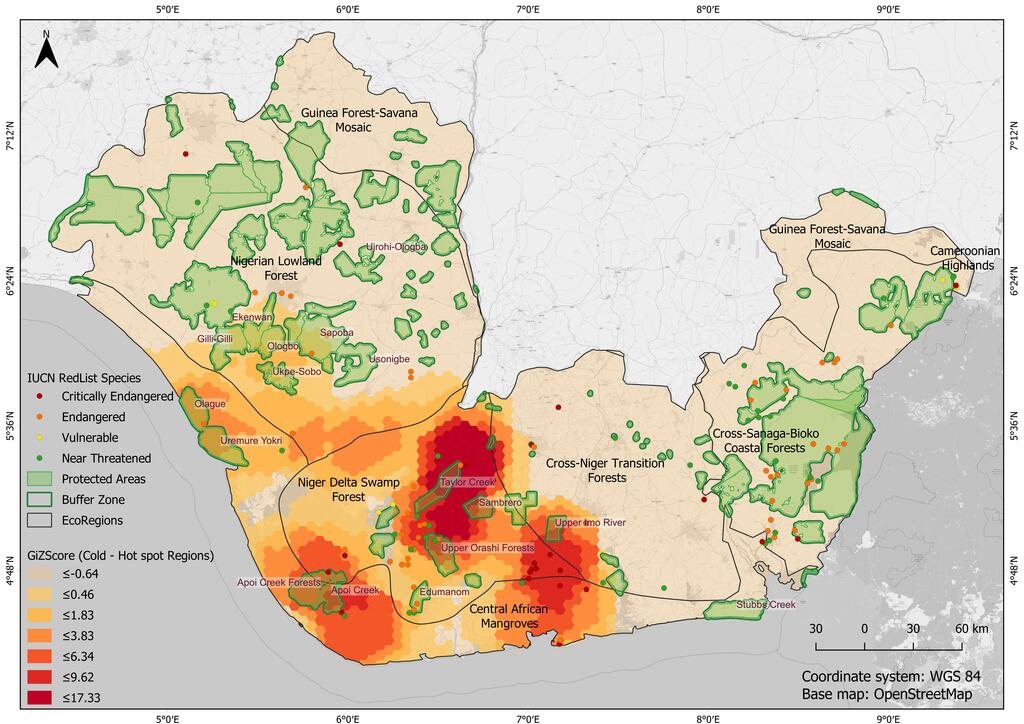
“The Niger Delta region of Nigeria has been battling with an unprecedented number of oil spills since the discovery of oil in 1950. As a recommendation given by the International Union for Conservation of Nature (IUCN–Niger Delta Panel), in response to its oil spill, there is the need to identify key sensitive and pristine areas that would need special protection in the event of their being threatened by oil spills. Hence this study seeks to explore why these oil spills happen, where they occur, and which areas are most affected. From the result, the majority of the spills occurred within 1 km distance from the pipelines with the level of accessibility of oil facilities influencing their chances of being sabotaged. From the Chi-square analysis, a p-value of 0.001 implied that there is a statistically significant relationship between the accessibility of an oil facility and its chances of being sabotaged. Oil spill cold and hotspot regions within the Niger Delta were identified, with protected areas being affected by the oil spills. This raises the question: How protected are the protected areas in the Niger Delta? Especially the already threatened biodiversity, faced with extinction due to the rampant bush hunting and fragmentation from logging.
With knowledge of where the oil spills occurred, the study assesses the potential and significance of remote sensing vegetation indices in assessing the environmental impact of oil spills on land cover. A pixel-based classification using Random Forest classifier in Google Earth Engine was performed to obtain the land use land cover information which was assigned to the 2704 oil spill incidence data obtained from the National Oil Spill Detection and Response Agency (NOSDRA). Oil spills within vegetated cover areas were analysed in comparison to the selected non-spill sites using boxplot. Five vegetation indices: Normalized Difference Vegetation Index (NDVI), Enhanced Vegetation Index (EVI), Soil-Adjusted Vegetation Index (SAVI), Normalized Green Red Difference Index (NGRDI) and Green Leaf Index (GLI) were used to measure the quantity and vigour of plants within the selected oil-polluted and non-polluted vegetated areas. All five indices were statistically significant at a p-value ≤ 0.0001. However, indices that incorporated the near-infrared band (NIR) in their calculation performed better, as they were able to differentiate spill and non-spill sites across the different vegetation cover areas.”

