Aim
Spectroscopy and hyperspectral remote sensing enables to retrieve very detailed spectral information about a certain surface in dense bandwith intervalls. Information on the “spectral fingerprints” of surfaces is then available in a near-continuous manner. This allows for the differentiation of materials, such different geologic surfaces, different urban materials, or plants of different composition and vigor. Especially field- and laboratory spectroscopy has shown many benefits, as measurements can be carried out in a controlled environment, and can be directly visualized and explained. This course provides you insights into practical experiments using a field spectrometer, and subsequent data analysis to assess key environmental parameters such as plant health, soil moisture content, and geologic composition.
Content
The content of this course includes both the theoretical background of field and imaging spectroscopy, as well as practical experiments and subsequent data analysis. In particular, we will adress: the theoretical background of field and imaging spectroscopy / general reflectance and transmittance properties of plant leaves, canopies and soils / the quantification of biophysical and biochemical properties using spectroscopic measurements, feature parametrization and regression analysis / the advantages and challenges of existing and planned hyperspectral spaceborne sensors
Coding
Software
Techniques
Content
General Course News and Updates
textbooks on remote sensing
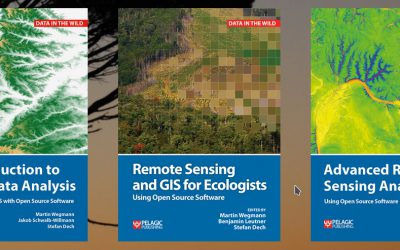
Our already published textbook on "Remote Sensing and GIS for Ecologists - using Open Source software" was very well perceived and we got very positive feedback. However, either an introduction or more advanced methods and data was asked for as well. Hence, we decided...
EAGLE summer dialogue 2019
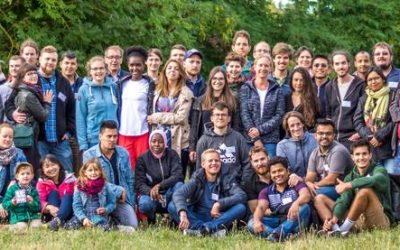
Our next EAGLE summer dialogue to bring together all EAGLE students and lecturer, staff of our department and all colleagues from close and far away is slowly approaching. On June 28th we welcome again everybody to join us for the EAGLE summer event with two keynotes:...
Julia Sauerbrey successful M.Sc. defense
Congratulations to Julia Sauerbrey who successfully presented her M.Sc. thesis. Read more about her interesting research project.
application deadline 2019 is approaching
Application deadline for the winter term 2019 is approaching
Internship and MSc presentations
On Thursday, May 23rd, we will have a range of very interesting internship, innovation lab and M.Sc. idea presentations (10 am, OKW 86, room 0.004): Sebastian Buchelt (Internship Presentation): "Assessment of classification algorithms on the example of sea ice - why...
M.Sc. defense by Julia Sauerbrey
Julia Sauerbrey will defend her M.Sc. "Integration of SAR and Optical Satellite Imagery: Time-Series Analysis of Sentinel-1 and Sentinel-2 Imagery for Detection of Active Morphodynamics: A Case Study in the Atacama Desert, Chile" on Thursday 9th of May at 10am in room...
EAGLE students preparing for ESA LPS 2019
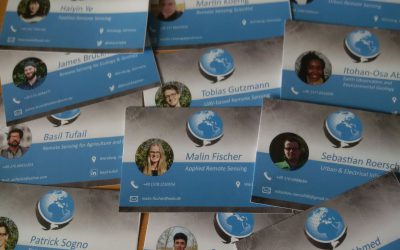
our EAGLE students are organizing a joint trip and accommodation to the ESA LPS symposium in Milan and are currently preparing all other things such as business cards. They are very much looking forward to many highly interesting presentations and to meet diverse...
Ahmed Saadallah successfully defended his thesis
We congratulate Ahmed for his great M.Sc. presentation and the whole audience for the very lively discussions on methods and implications plus historical reasons of the detected patterns. Another EAGLE M.Sc. students graduated and is now an Earth Observation...
check out the news blog by our students
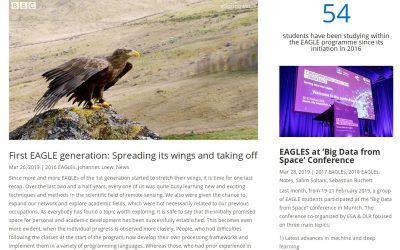
Our EAGLE students are posting various news about their activities, experiences or codes they developed. Read about their past years within the EAGLE program, their participation in international remote sensing conferences or what they achieved within EAGLE courses....
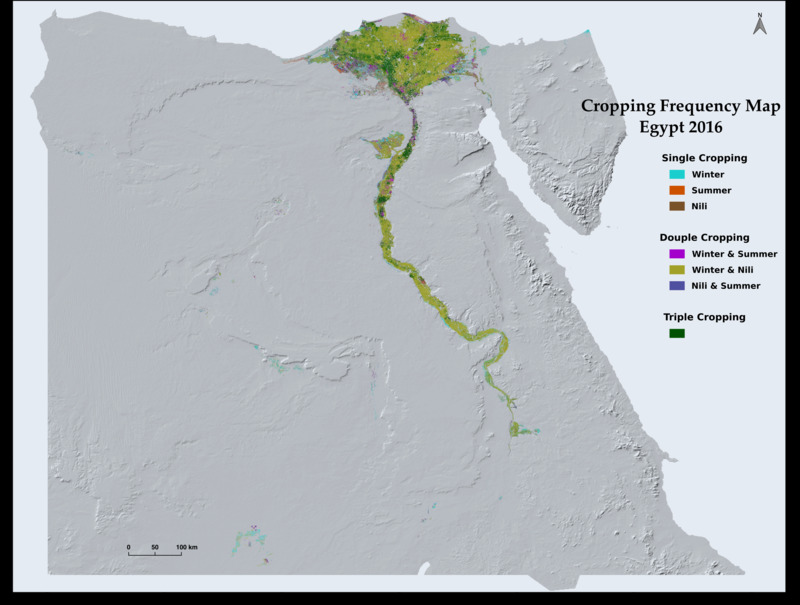
M.Sc. thesis presentation by Ahmed Saadallah
Ahmed Saadallah will defend his M.Sc. thesis "The Potential of Earth Observation for Monitoring Agricultural Lands in Egypt (1984-2017)" on Wednesday 10th of April at 2pm in the student working room JMW 52. The need for accurate and timely information on the extent...

