There’s a new R package on the block, and it’s solving a problem that sounds simple until you actually try to do it: how do you tell whether putting solar panels over a farm field is good or bad for the soil and the crops around them?
Marlene, one of our EAGLE students, just presented agropvR for our 1st semester programming course, it is a package built specifically for mapping the environmental footprint of agrophotovoltaic facilities across Bavaria and Baden-Württemberg using Sentinel-2 imagery. Agrophotovoltaics, or agriPV if you want the shorter version, is the idea of combining solar energy production with farming on the same plot of land. The panels create shade, which can lower soil and air temperature and cut down on heat stress for crops. In theory it’s a neat way to get more value out of the same hectare. In practice, nobody really knew how to measure it at scale, and that’s exactly the gap Marlene’s package fills.
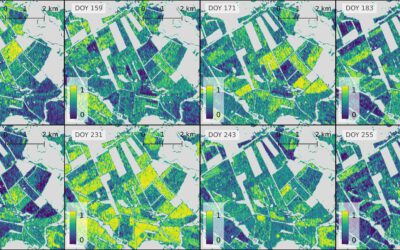
The package leans on three spectral indices to do the heavy lifting. NDVI tracks vegetation greenness and health, NDMI picks up on moisture in the soil and plants, and BSI flags how much bare soil is exposed. Run all three side by side on an agriPV site and a paired reference field nearby, and you start to see whether the panels are actually changing things around them, or not. One detail that’s easy to miss but actually matters a lot: the package masks out every pixel covered by a panel before calculating any statistics. So the numbers you get reflect the crops and soil around the panels, not some weird mashed-up signal from the panel surface itself.
What’s genuinely useful here is that Marlene didn’t just write some analysis scripts and call it done. She built out a full workflow. There’s a pre-computed cache people can download from Zenodo so they’re not stuck waiting on satellite processing every time. There are built-in datasets, 25 agrivoltaic sites and their paired reference fields, plus 655 individual panel footprints, all digitized from the Fraunhofer ISE Agrivoltaics Map and satellite basemaps in QGIS. You can plot time series of all three indices for a site, map them spatially, or compare overhead versus interspace system designs across multiple sites at once. And if your site of interest has a data gap because of cloud cover, there’s a function to go fetch a new Sentinel-2 scene yourself.
It’s the kind of package where you can tell some real frustration went into making it usable, not just functional. Anyone working on agriPV research, whether that’s planning new sites or evaluating existing ones, now has a tool that gets them from zero to an actual index comparison in a handful of function calls instead of weeks of manual GIS work.
You can find agropvR on GitHub at github.com/marlenecss/agropvR, install instructions and all.