Great dashboard by our EAGLE students

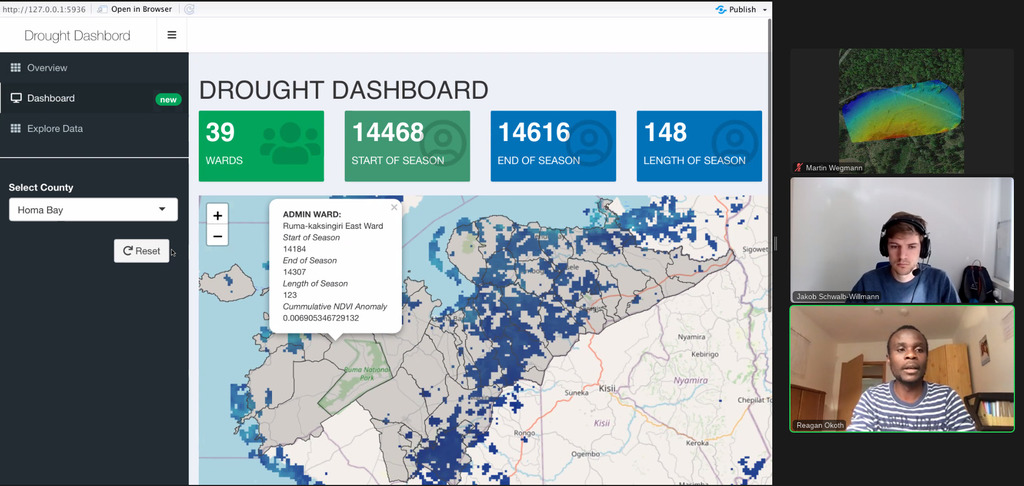
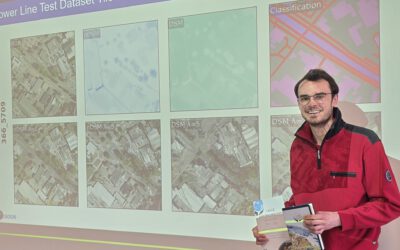
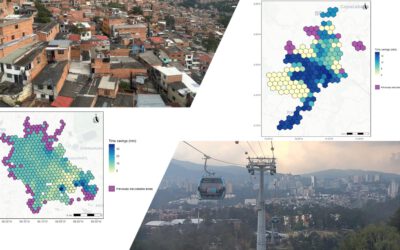
our EAGLE students created various informative remote sensing and spatial environmental data dashboards and learned a lot how to communicate their Earth Observation research in an interactive online platform. One example by our student Ronald Okoth is shown below and the two lecturer of this scientific graphic course Jakob Schwalb-Willmann and Martin Wegmann.

read more news:

🗺 Exploring Map Visualizations

🗺 Exploring Map Visualizations

Within our EAGLE courses our students have to learn a wide variety of skills - beside the fundamental earth observation theory and practice also skills like map creation is part of the curriculum. One of our students Ronja Seitz has created three visualizations guides...

Course on Object-based image analysis

Course on Object-based image analysis

Dr. Michael Wurm from the German Aerospace Center (DLR) gave a class about Object-based image analysis (OBIA) using the eCognition Software for the EAGLE students. The course gives an insight into the theoretical basis of OBIA and using different datasets and tasks...