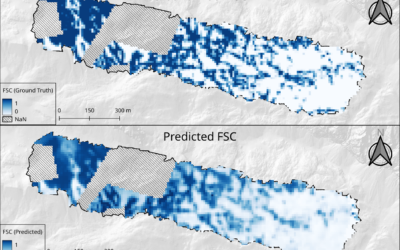
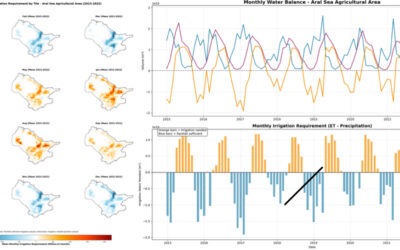
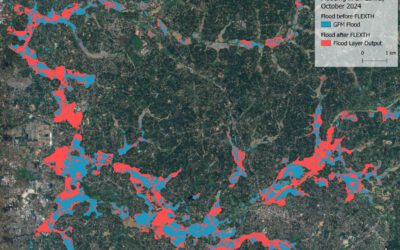
our EAGLE student Konstantin Müller created a QGIS plugin and a corresponding R package for easy point density vizualisation. Create way to learn how to build QGIS plugins and R package for spatial analysis.
QGIS plugin:
-
The Bestagon QGIS plugin allows easy density visualizations for points and also lines since the newest version. Through a simple UI and background threading it holds up to most plugins available and makes density visualization fast and reliable. https://github.com/KonstiDE/Bestagon
Formizer R plugin
-
The Formizer R plugin mirrors what Bestagon does in QGIS, however, in R. Due to more self-made grids and algorithms, density visualizations are fast and easy, as well as uniquely customizable. Moreover, it provides exemplary data and 3d plot options. https://github.com/KonstiDE/FormizeR


