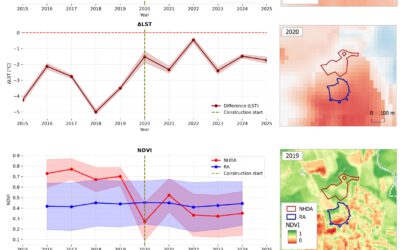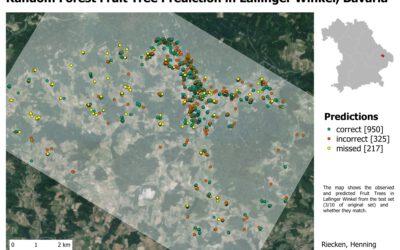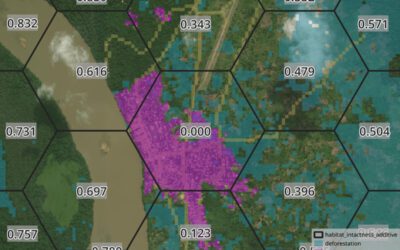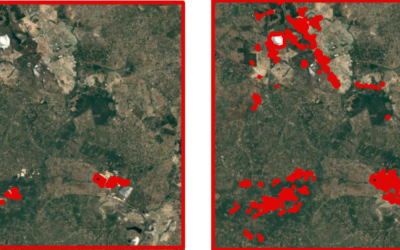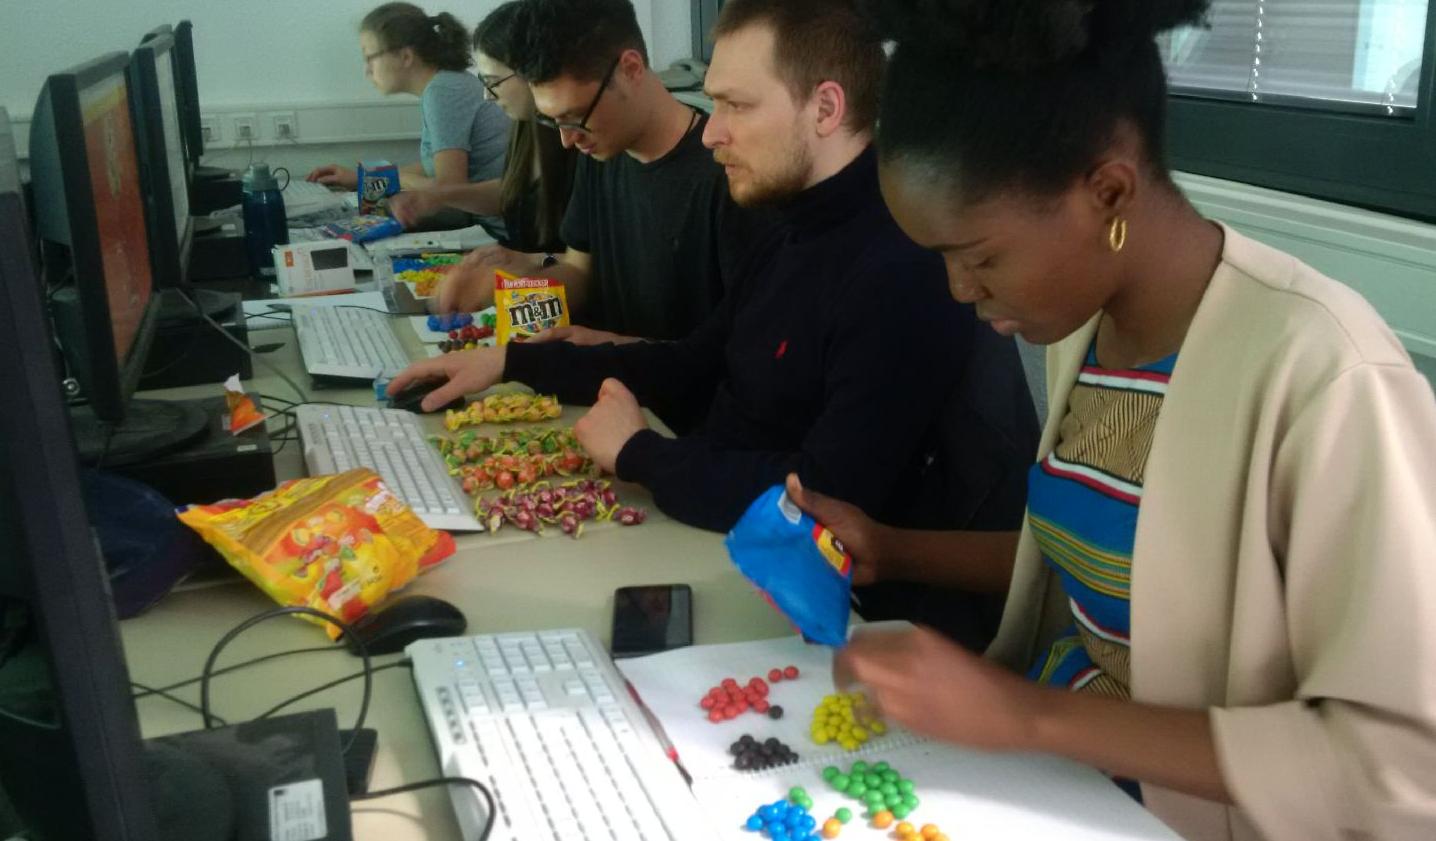
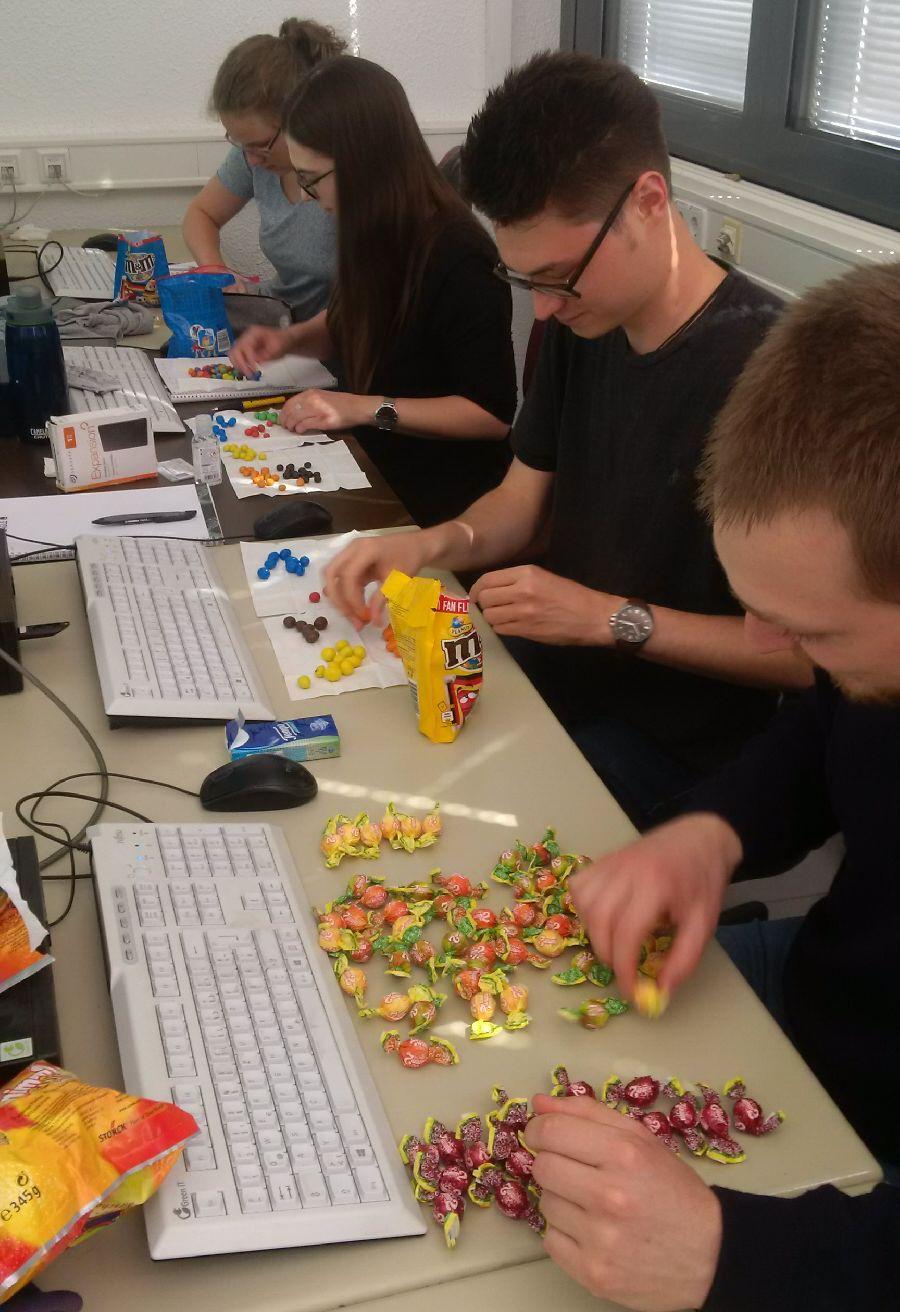
 Today our EAGLE students applied data munging, pipes, plotting and statistics using colour distribution of sweets. They specifically used the dplyr, ggplot, kableExtra and others to compute derivatives, rearrange the data, plot it and run statistics on colour distribution differences between different sweet packages. After this initial task of the course “spatial prediction and modelling” actual spatial prediction of in-situ point data combined with remote sensing data will be performed. This course will cover a wide range of approaches and packages to run spatial models and predict them spatially and temporally.
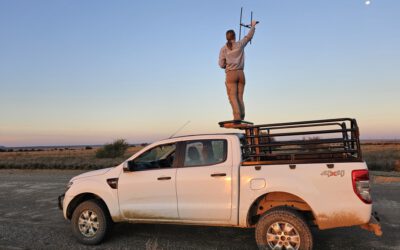
Night shifts with the black-footed cat: Jolien Grafe’s internship in Benfontein
Most remote sensing work happens in the daylight, at a desk or in a field with a drone. Jolien Grafe, one of our EAGLE M.Sc. students, spent a good part of her internship doing the opposite: sitting on a hill at dusk, listening for a beeping signal from a very small,...
![[Spotlight] Lecturer Spotlight: Julian Faeth](https://eagle-science.org/wp-content/uploads/2026/10/Julian_Faeth_EORC_EAGLE_2026-400x250.jpg)